 Tweet
Tweet
Originally posted by tabibito
View Post
-
I would not call it slander. You threw out a bunch of graphs without a coherent argument. I believe Roy responded with some good sources to clarify the issue. -
One graph only was at issue, in so far as I am aware. I had 3 different sources open at the time, checking the details, and inadvertently muddled where what was coming from. I hadn't even heard of this c3 thing before Roy mentioned it. What grounds does anyone on TWeb have for accusing me of deliberately lying - beyond prejudice?1Cor 15:34 Come to your senses as you ought and stop sinning; for I say to your shame, there are some who know not God.
.⊛⊛⊛⊛⊛⊛⊛⊛⊛⊛⊛⊛⊛⊛⊛⊛⊛⊛⊛⊛⊛⊛
Scripture before Tradition:
but that won't prevent others from
taking it upon themselves to deprive you
of the right to call yourself Christian.
⊛⊛⊛⊛⊛⊛⊛⊛⊛⊛⊛⊛⊛⊛⊛⊛⊛⊛⊛⊛⊛Comment
-
I personally do not accuse you of lying, but just presenting muddled evidence to justify your agenda.Originally posted by tabibito View PostComment
-
Evidence.Originally posted by tabibito View Post
This is the graph from your cited source:
Kobashi.jpg
This is the graph from c3headlines:
c3headlines.jpg
Note the differences:
1) The fonts on the axes (serif vs san serif)
2) The colour of the central line (black vs red)
3) The text on the central line ("present temp." vs "Current Temp")
4) The colour (mid-green vs emerald) and shape (circle vs oval) of the green marker
5) The units on the time axis (B.C.E./C.E. vs BC/AD)
6) The text at the top ("Past 4000 years" vs "Bronze Age Warming" etc)
7) The text on the dash lines (+/- 2 sigma vs nothing)
8) The additional text at the top and bottom of the c3headlines version.
There are artefacts around the central line and the emerald oval on the c3headlines graph that suggest it is a modified version of the Kobashi graph rather than the other way around, so the original would be identifiable even if the c3headlines graph did not include notes identifying the original source and stating "Additional info/edits by www.c3headlines.com". Some-one at c3headlines took the Kobashi graph and made some cosmetic changes to it.
This is the graph you posted (red circle is my annotation):
tabibito.jpg
Not only does the graph you posted match the c3headlines graph in every respect, it includes the note saying it was edited by c3headlines. Yet you nevertheless claim it came from the American Geophysical Union, and not c3headlines.
Mendacious coprolite.
RoyLast edited by Roy; 08-17-2015, 06:05 PM.Jorge: Functional Complex Information is INFORMATION that is complex and functional.
MM: First of all, the Bible is a fixed document.
MM on covid-19: We're talking about an illness with a better than 99.9% rate of survival.
seer: I believe that so called 'compassion' [for starving Palestinian kids] maybe a cover for anti Semitism, ...Comment
-
You really like accusing people of lying without having substantive evidence, don't you? (And no, what you posted above doesn't count as substantiveOriginally posted by Roy View Post )
)
I mean, you did the same thing in a discussion with seer, didn't you? Why can't you just settle with calling them wrong instead of accusing them of lying on the most flimsiest of grounds?
Comment
-
He posted a graph stamped with the c3headlines URL then tried to pretend he got it from an original source. What's the alternative?Originally posted by Chrawnus View PostJorge: Functional Complex Information is INFORMATION that is complex and functional.
MM: First of all, the Bible is a fixed document.
MM on covid-19: We're talking about an illness with a better than 99.9% rate of survival.
seer: I believe that so called 'compassion' [for starving Palestinian kids] maybe a cover for anti Semitism, ...Comment
-
So he missed not only the note on the graph he posted, but also the differences between the two versions, the differences between the two websites (different layout, different background, different context), the different number of graphs? And then made exactly the same mistakes when double-checking, while also neglecting to revisit his original post?Originally posted by Chrawnus View Post
That seriously strains credulity.
But if you want further substantiation, go back and look at the source text of the post in which he first presented the graph - you'll see what I've just spotted. He didn't copy that graph as an image - he linked directly to c3headlines.com.Jorge: Functional Complex Information is INFORMATION that is complex and functional.
MM: First of all, the Bible is a fixed document.
MM on covid-19: We're talking about an illness with a better than 99.9% rate of survival.
seer: I believe that so called 'compassion' [for starving Palestinian kids] maybe a cover for anti Semitism, ...Comment
-
Ah now - "straining credulity" would not have been a slander. You would have been stating a reasonable basis for disbelieving my claim. However, had I been deliberately lying - it would have been simple enough to paste an edited screen shot. You have said "I just noticed" - it took you so much time to notice that I had posted the link, and you only noticed the identity of the link AFTER you had made the allegation? So - what would "strain credulity" to believe that what I did was carelessness?Originally posted by Roy View Post
I have never made the claim that Global Warming is not a fact - nor have I denied that human activity is a factor. My claim has been - here, and in prior discussions on the matter - that the contribution of human activity is overstated.Last edited by tabibito; 08-17-2015, 07:07 PM.1Cor 15:34 Come to your senses as you ought and stop sinning; for I say to your shame, there are some who know not God.
.⊛⊛⊛⊛⊛⊛⊛⊛⊛⊛⊛⊛⊛⊛⊛⊛⊛⊛⊛⊛⊛⊛
Scripture before Tradition:
but that won't prevent others from
taking it upon themselves to deprive you
of the right to call yourself Christian.
⊛⊛⊛⊛⊛⊛⊛⊛⊛⊛⊛⊛⊛⊛⊛⊛⊛⊛⊛⊛⊛Comment
-
It's fine for you to claim that human contributions have been overstated by the scientific community. But everybody listening to you has a right to ask what the basis for this claim is. And if you can't back it up with solid evidence (and so far, you haven't), then it's appropriate to disregard your claim.Originally posted by tabibito View Post
As an aside: you appear to be currently arguing that recent warming is not unprecedented in the climate record. To do that, you're using temperature data from ice cores. Ice cores take ~300 years for the snow to solidify into ice sufficiently for bubbles of air to be permanently sealed off from exchange with the atmosphere. Given that, they're absolutely useless for determining the most recent conditions.
Therefore, data from ice cores cannot possibly speak to the warming of the last century. The fact that you think they can provides some indication of how informed your opinion is. If you want to convince people who know something about climate science, you really have to up your game. If you simply want to claim something and have your claims ignored, you may carry on."Any sufficiently advanced stupidity is indistinguishable from trolling."Comment
-
Start point: historical sea levels. If global temperatures are rising, that rise should be reflected in sea levels. Have sea levels been rising? Certainly - ever since the mini ice age of the 1700s.
Historical sea level CHANGES
Last few hundred years
Changes in local sea level estimated from sediment cores collected in salt marshes reveal an increase in the rate of sea level rise in the western and eastern Atlantic Ocean during the 19th century and early 20th century, consistent with the few long tide-gauge records from Europe and North America. The figure below shows data from Vidarholmi, Iceland (data from Roland Gehrels, Gehrels et al., 2006) and Connecticut, USA (data from Dr Jeff Donnelly, WHOI Coastal System Group , Donnelly et al., 2004).
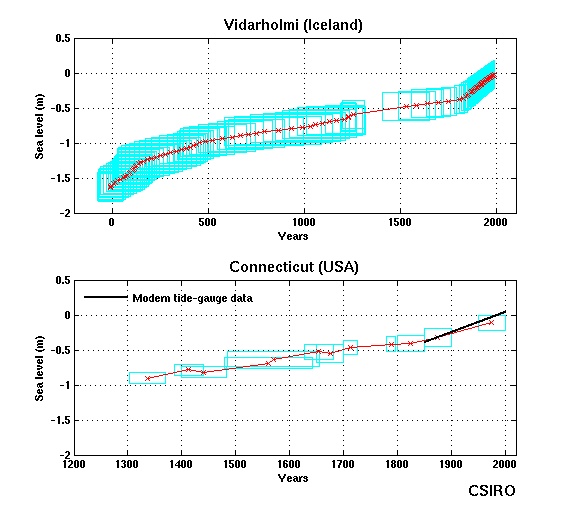
The central estimates of sea level (relative to the present) are shown as red crosses. The light blue boxes show the uncertainties (in height and time) of the measurements. Note the different time scales of the two panels. Note also that these measurements are of sea level relative to the land. Estimates shown below and elsewhere on this site have the effects of vertical land movement taken out, so changes in sea level on the above figures may seem inconsistent with other graphs on this site. For example, the east coast of the USA is sinking due to the ongoing effects of the retreat of the Laurentide Ice Sheet at the end of the last Ice Age, so the rate of sea-level rise relative to the land is higher than it would otherwise be.
Comparison of data from the coasts of the Atlantic Ocean - admittedly from a small number of samples - is consistent: sea levels rose at an increased rate through the 19th and 20th centuries.
Maybe there will be some dispute about my interpretation of the cited statement.
The few very long tide gauge records all show an increase in the rate of sea level rise from the 18th century.
Sea levels were already rising from the low of the mini ice age of the 1700s (oh ... that's the 18th century: go figure) - the rate increased during the past 150 to 200 years.
It seems to me that the claim is - climate warming is attributable to human activity in the latter half of the 20th century. What accounts for the prior 150 years of the rise in sea level then? Did the base cause of the warming during that time suddenly cut out, with human activity picking up where it left off?
Source for the above data: CSIRO
Part 1 concluded:Last edited by tabibito; 08-18-2015, 04:29 AM.1Cor 15:34 Come to your senses as you ought and stop sinning; for I say to your shame, there are some who know not God.
.⊛⊛⊛⊛⊛⊛⊛⊛⊛⊛⊛⊛⊛⊛⊛⊛⊛⊛⊛⊛⊛⊛
Scripture before Tradition:
but that won't prevent others from
taking it upon themselves to deprive you
of the right to call yourself Christian.
⊛⊛⊛⊛⊛⊛⊛⊛⊛⊛⊛⊛⊛⊛⊛⊛⊛⊛⊛⊛⊛Comment
-
Next: Paleoclimatology. The limit of tree growth will extend further from the equator as global temperatures rises.
. Elevational tree line retreat characterized the Holocene tree line evolution. For short periods, excursions from this trend have occurred. Between c. 12 000 and 10 000 cal. a BP, a pine-dominated subalpine belt prevailed. A first major episode of descent occurred c. 8200 cal. a BP, possibly forced by cooling and an associated shift to a deeper and more persistent snow pack. Thereafter, the subalpine birch forest belt gradually evolved at the expense of the prior pine-dominated tree line ecotone. A second episode of pine descent took place c. 4800 cal. a BP. Historical tree line positions are viewed in relation to early 21st century equivalents, and indicate that tree line elevations attained during the past century and in association with modern climate warming are highly unusual, but not unique, phenomena from the perspective of the past 4800 years. Prior to that, the pine tree line (and summer temperatures) was consistently higher than present, as it was also during the Roman and Medieval periods, c. 1900 and 1000 cal. a BP, respectively.
I don't know the credentials of Boreas Magazine, but it does seem to be legit - and the information in the abstract is available elsewhere, I'm sure. So if this doesn't satisfy, I'll continue the line of enquiry.1Cor 15:34 Come to your senses as you ought and stop sinning; for I say to your shame, there are some who know not God.
.⊛⊛⊛⊛⊛⊛⊛⊛⊛⊛⊛⊛⊛⊛⊛⊛⊛⊛⊛⊛⊛⊛
Scripture before Tradition:
but that won't prevent others from
taking it upon themselves to deprive you
of the right to call yourself Christian.
⊛⊛⊛⊛⊛⊛⊛⊛⊛⊛⊛⊛⊛⊛⊛⊛⊛⊛⊛⊛⊛Comment
-
Of course - there is the NOAA site, which points out that the higher temperatures of 6000 years did not have the same cause as the current temperature rises.
It becomes a matter of investigating what might have caused the cooling of 250 - 300 years ago ... or, more properly, what stopped that cooling and caused the temperatures to begin rising.
Medieval Warm Period - 9th to 13th Centuries
Norse seafaring and colonization around the North Atlantic at the end of the 9th century indicated that regional North Atlantic climate was warmer during medieval times than during the cooler "Little Ice Age" of the 15th - 19th centuries. As paleoclimatic records have become more numerous, it has become apparent that "Medieval Warm Period" or "Medieval Optimum" temperatures were warmer over the Northern Hemisphere than during the subsequent "Little Ice Age", and also comparable to temperatures during the early 20th century. The regional patterns and the magnitude of this warmth remain an area of active research because the data become sparse going back in time prior to the last four centuries.
In summary, it appears that the late 20th and early 21st centuries are likely the warmest period the Earth has seen in at least 1200 years. For a summary of the latest available research on the nature of climate during the "Medieval Warm Period", please see Box 6.4 of the IPCC 2007 Palaeoclimate chapter. To learn more about the "Medieval Warm Period", please read this review published in Climatic Change, written by M.K. Hughes and H.F. Diaz. (Click here for complete review reference). Discussion of the last 2,000 years, including the Medieval Warm Period, and regional patterns and uncertainties, appears in the National Research Council Report titled "Surface Temperature Reconstructions for the Last 2,000 Years", available from the National Academy Press.
2008 report - NOAA
But it doesn't go into matters of what may have caused the warmer period of 2000 years ago, nor what caused the warm period of the ninth century, nor the cooling of the early 18th century nor the subsequent warming. Or maybe it does, and I missed it.Last edited by tabibito; 08-18-2015, 05:12 AM.1Cor 15:34 Come to your senses as you ought and stop sinning; for I say to your shame, there are some who know not God.
.⊛⊛⊛⊛⊛⊛⊛⊛⊛⊛⊛⊛⊛⊛⊛⊛⊛⊛⊛⊛⊛⊛
Scripture before Tradition:
but that won't prevent others from
taking it upon themselves to deprive you
of the right to call yourself Christian.
⊛⊛⊛⊛⊛⊛⊛⊛⊛⊛⊛⊛⊛⊛⊛⊛⊛⊛⊛⊛⊛Comment
-
What strains credulity about you being merely careless rather than dishonest is that you claimed to be using graphs from original sources (American Geophysical Union and the NAS) even after the graphs you posted had been identified as being obtained elsewhere. You have deliberately and repeatedly concealed your actual sources. While it might be careless to assume that the graph you posted was a genuine copy, extremely careless not to notice the various telltale signs that it had been modified, and unbelievably careless not to notice the differences between the graph you originally posted and the one you found on "double checking", it is definitely not carelessness to pretend you got that graph from somewhere you didn't. There is not a snowball's chance in Dante's sixth circle that you were unaware that the site you really obtained that graph from - which you have still not identified - was not the primary source that you subsequently referenced.Originally posted by tabibito View Post
Not noticing the graph you posted had been edited might be carelessness. Misrepresenting where you acquired it is lying.
You lied.
RoyJorge: Functional Complex Information is INFORMATION that is complex and functional.
MM: First of all, the Bible is a fixed document.
MM on covid-19: We're talking about an illness with a better than 99.9% rate of survival.
seer: I believe that so called 'compassion' [for starving Palestinian kids] maybe a cover for anti Semitism, ...Comment
-
Those were the tabs that I had open at the time that I posted the response.Originally posted by Roy View Post
Which part of the link that you clicked to find the actual sources actually concealed the actual sources?You have deliberately and repeatedly concealed your actual sources.1Cor 15:34 Come to your senses as you ought and stop sinning; for I say to your shame, there are some who know not God.
.⊛⊛⊛⊛⊛⊛⊛⊛⊛⊛⊛⊛⊛⊛⊛⊛⊛⊛⊛⊛⊛⊛
Scripture before Tradition:
but that won't prevent others from
taking it upon themselves to deprive you
of the right to call yourself Christian.
⊛⊛⊛⊛⊛⊛⊛⊛⊛⊛⊛⊛⊛⊛⊛⊛⊛⊛⊛⊛⊛Comment

| Topics | Statistics | Last Post | ||
|---|---|---|---|---|
|
0 responses
3 views
0 likes
|
by rogue06
Yesterday, 02:47 PM
|
|||
|
1 response
9 views
0 likes
|
by Sparko
Yesterday, 01:14 PM
|
|||
|
0 responses
12 views
1 like
|
by rogue06
04-27-2024, 09:38 AM
|
|||
|
5 responses
23 views
0 likes
|
by shunyadragon
04-28-2024, 08:10 AM
|
|||
|
2 responses
12 views
0 likes
|
by shunyadragon
04-25-2024, 10:21 PM
|
Comment